Connect data sources
ERP, CRM, finance, project software, spreadsheets – with defined access.

Data from CRM, ERP, projects and other sources is consolidated, prepared and made usable in reports, key figures and explainable analyses.
In short: Instead of gathering figures from different systems by hand, you connect defined data sources and calculate key figures reproducibly. AI can prepare summaries, anomalies and pointers for further research. The key figure itself needs a clear definition of its data and calculation.
ERP, CRM, finance, project software, spreadsheets – with defined access.
Which figure comes from where and how it is calculated.
Reproducibly, based on the central definitions.
Flag anomalies compared with the previous period, plan or threshold.
Summary, hypotheses and research pointers as a draft.
To the defined recipients at the agreed time – after approval.
Examples from the workflow – no percentages, as only a measurement in your business can provide those.
| Situation | Today | With the solution |
|---|---|---|
| Weekly report | Friday, by hand in Excel | produced at the agreed time, checked by management |
| Key figure | calculated differently by each department | one definition, one calculation |
| Deviation | noticed if someone happens to look | flagged, with pointers to possible causes |
| Commentary | rewritten | draft from the data, reviewed by experts |
Central definitions and traceable origin.
No more gathering and formatting by hand.
Deviations are flagged, hypotheses prepared.
Key figures are designed to show their data source.
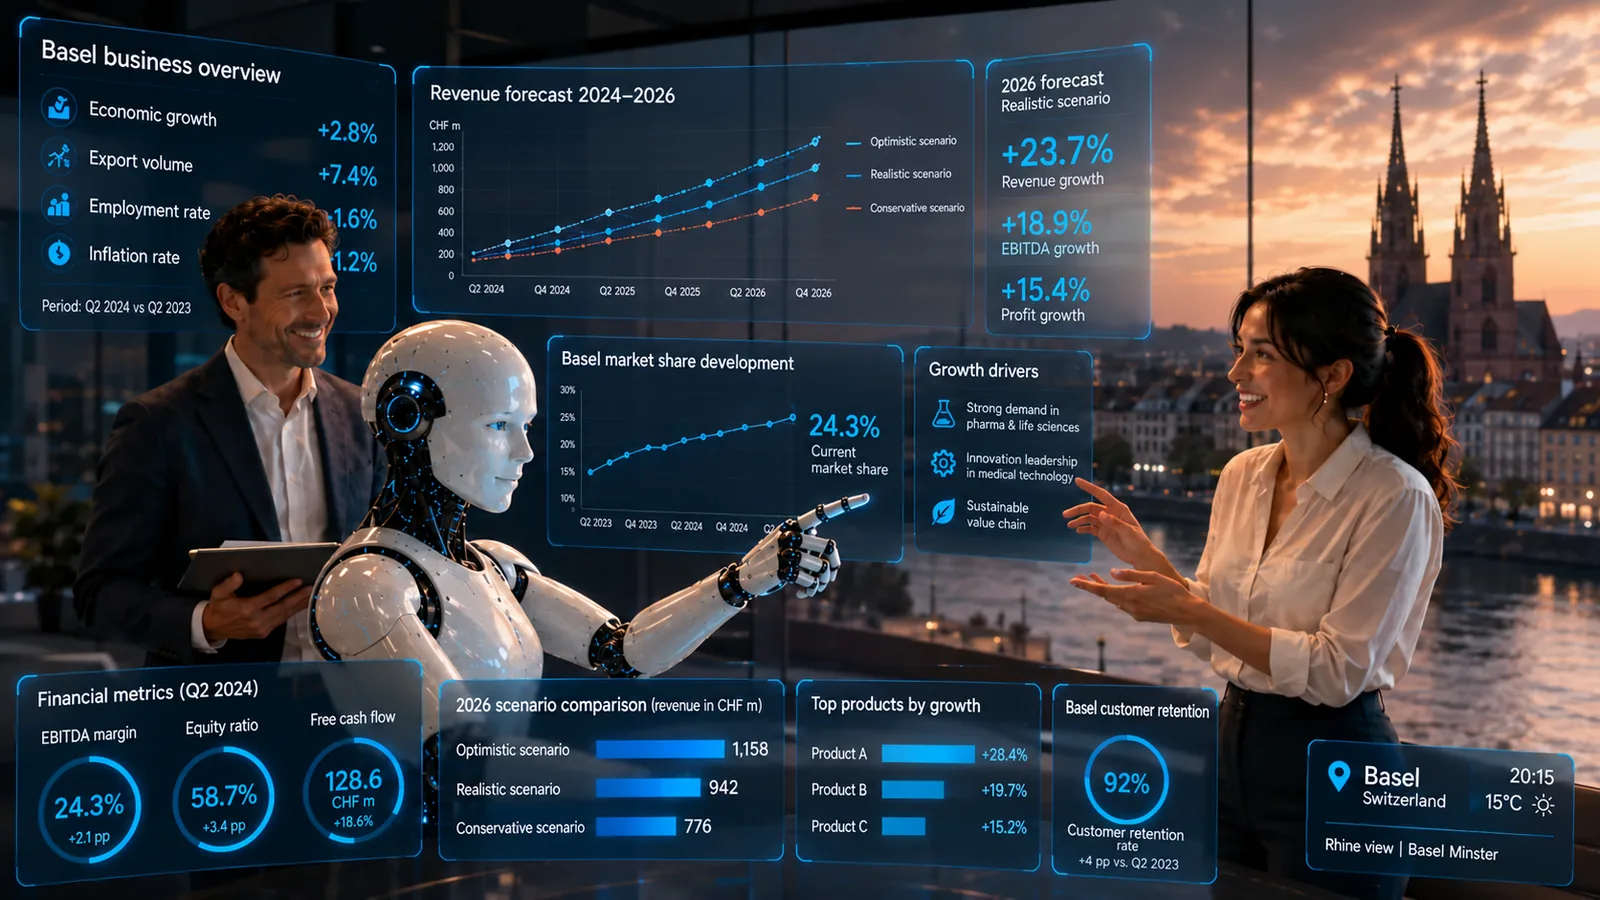
Sample images from our visual library – the interfaces shown are illustrations, not client data.


The definition of the key figures, the expert review of causes and every decision that follows from the report. AI prepares; people check causality.
The solution prepares, sorts and hands over – your staff make decisions and grant approvals, following rules you set.

For example – what exactly gets connected depends on interfaces and permissions and is checked in the AI potential assessment.
Solution building blocks are the technical components of the Swiss AI Platform, combined by process.
Preparation, summary, anomalies.
View building blockData flows and schedules.
View building blockWhen the data model and reports are bespoke.
View building blockDepending on the product and interfaces, we run the solution on your premises, in a Swiss cloud or as a combination. Before the pilot, we clarify data flows, access rights and compliance requirements. Background: Private AI and On-premise & hybrid (running on your own servers or a mix of both).
| Topic | Implementation |
|---|---|
| Data | Financial, customer and project data – confidential. |
| Approvals | The responsible manager reviews reports before distribution; key figures shared externally are approved. |
| Roles & permissions | Who sees which key figures and raw data, by role; source system permissions still apply. |
| Logging | Data origin, calculation and distribution traceable for each report. |
| Operating model | Running on your own servers or in a private cloud for financial data; existing BI platforms can be supplemented. |
The pilot does not cover the whole process straight away. We pick a clearly defined part, set approvals and success criteria and test it with real data and the people who work with it. This approach is the same for every use case.
Not necessarily. It can complement existing BI and data platforms.
It can prepare correlations and hypotheses. Experts must check cause and causality against the data.
Through central definitions, data lineage and traceable calculation logic.
Companies with several data sources and regular reports to management, project management or the board of directors that are currently compiled by hand.
Describe your current workflow in two sentences. We check the benefit, data situation, integration effort and risks and show whether a product, a solution building block or a custom solution makes sense.